Welcome to the new ESIP website!
Humanitarian Mapping: Eradicating Malaria with Data Sharing
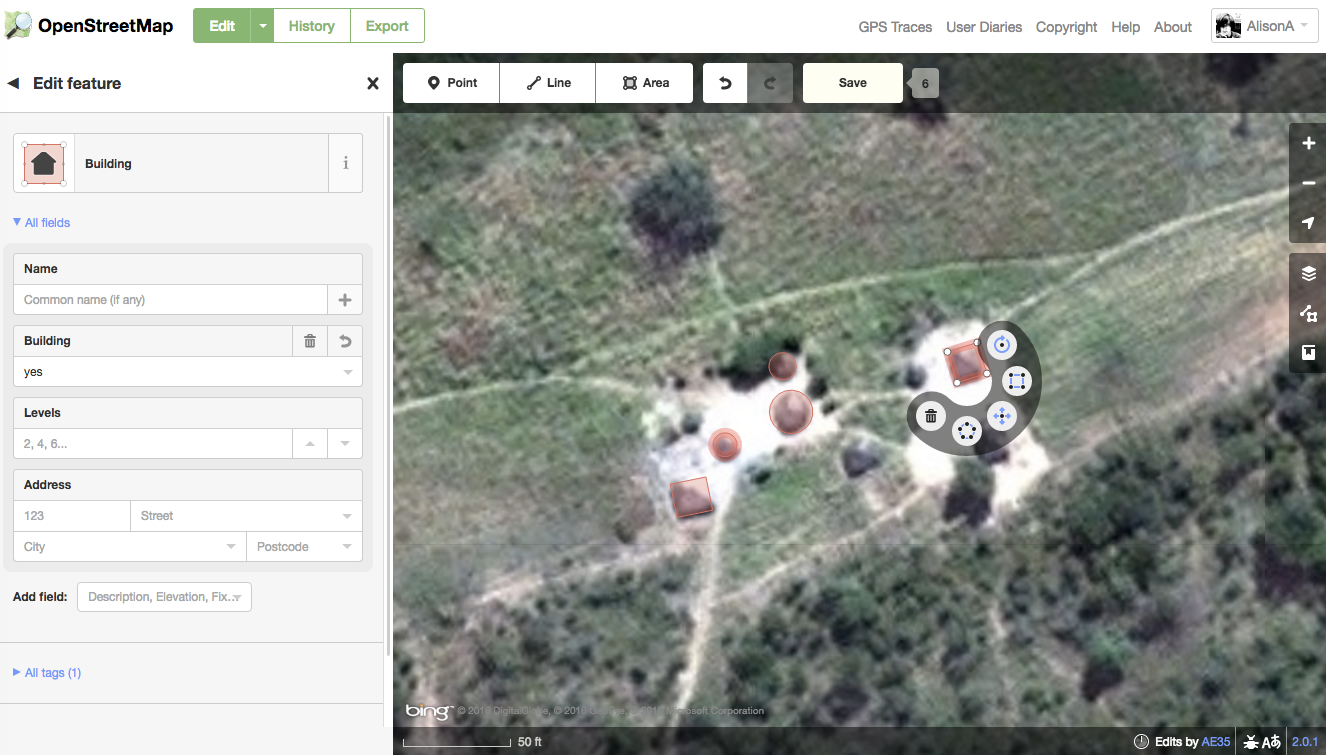
We are sitting in a brightly-lit computer lab with 19 other University of Vermont (UVM) students. Everyone is scrolling through satellite imagery of landscapes in Zambia, looking for small grey clusters of pixels with regular shadows that indicate buildings. When we find buildings, we draw outlines around them, creating a digital map that humanitarian aid workers can use to determine how many people live in an area; this allows them to direct funds efficiently and deploy targeted malaria relief equipment.
This project is part of a larger global effort called Humanitarian OpenStreetMap. Humanitarian OpenStreetMap Teams (HOTs), or people working individually, digitize relevant data based on OpenStreetMap satellite imagery to aid in humanitarian relief efforts. Some projects, like this one, are part of ongoing public health or economic development projects. Others are rapid-response efforts, contributing to building and road network knowledge to help first responders in disaster response and aid.
Humanitarian Mapping: Alison in Action!
—The Humanitarian OpenStreetMap Team (HOT) is self-described as a project “[applying] the principles of open source and open data sharing for humanitarian response and economic development.”
“It’s essentially the Wikipedia of maps, and we’re using it for humanitarian purposes,” says Noah Ahles, a Research Specialist in UVM’s Spatial Analysis Lab. Ahles has been hosting mapping events in his free time since October 19th, 2014 (he remembers the exact day), during the Ebola outbreak in West Africa. Since then he’s hosted approximately 20 “mapathons” to digitize maps for a variety of humanitarian causes, from a massive landslide in Nepal to the earthquake in Ecuador earlier this year. All together, the University of Vermont tags all edits made with #uvmMapping, which allows us to see what’s been mapped by UVM students. Tracking this hashtag, it is possible to visualize usage statistics at ResultMaps – and in the last 30 days, there have been 31 UVM contributors who have made 24,194 map changes (and it's also exciting to track and visualize your own personal contributions to HOT as a heat map):
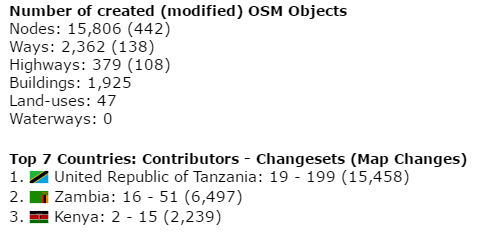
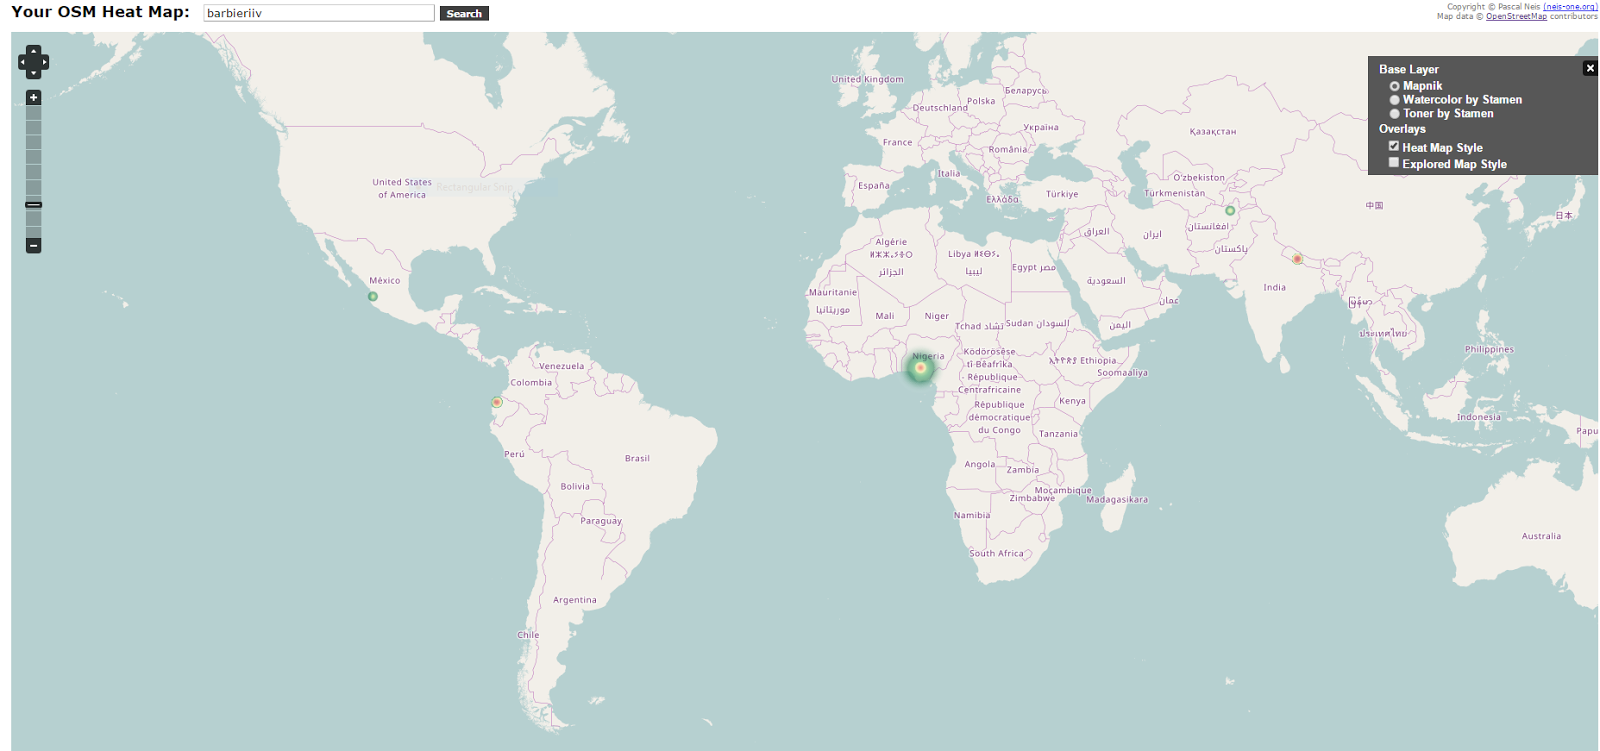
UVM Contributions to HOT & Barbieri's map of HOT activity
—Today, this team of students is digitizing buildings that will provide tools to help eliminate malaria in Zambia. Malaria affects more than 4,000 Zambians annually, but efforts in recent decades to provide mosquito nets and other disease-prevention equipment have met with significant success; the World Health Organization reports that malaria deaths in Zambia decreased from approximately 9,000 in 2001 to around 3,000 in 2014.
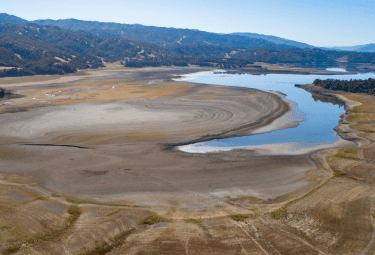
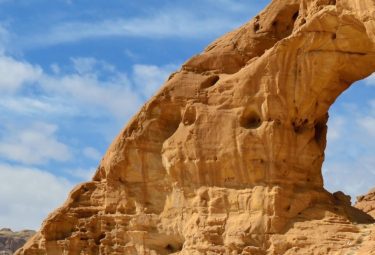
The buildings mapped are located in remote areas in small clusters, so they can be hard to find. The project provides a photo gallery of the landscapes and types of buildings that we’re mapping, which helps provide context. Spending so much time looking closely at the landscape also piques our curiosity: How do the people who live here get around? Do they own all of the land? What crops are being grown on the farm land we scroll past?

An image of the types of buildings being mapped for the Malaria HOT project in Zambia
—Like many other crowd-sourced data-sets, projects like this rely on contributions from volunteers! If you’re interested in getting involved or creating your own HOT group, you can get started at mapgive.state.gov. For questions or comments, or for more mapping related fun & updates, follow us on twitter –> Alison @albabs and Bar @barbieriiv
Enjoy your Mapping!